
Report 07-2013 POLICY BRIEF May 2013
INSTITUTE of PUBLIC POLICY
Harry S Truman School of Public Affairs
Comparing Taxes in Missouri and
Surrounding States
Judith Stallmann, Andrew Wesemann and David Valentine
Introduction
States and communities have pursued economic development strategies for
over 30 years but little is known about the overall effectiveness of those
strategies. All states are concerned with jobs and economic development,
particularly in times of economic downturn, and overall taxes are
frequently a part of the discussion of strategies to improve a state’s
competitive position. Several states reduced individual income tax rates in
the early 2000s to spur spending and economic growth, and both Kansas
and Nebraska did the same in 2012. Kansas reduced its individual tax rates
and cut non-wage income taxes for some corporations—mainly small
businesses—explicitly to spur economic development in the state and cut
the size of government (Peters, 2012). Although the impact of these
changes on the Kansas economy, and on the ability of the state to fund state
Talking Points
Taxes paid are a combination of the tax rate and the tax base.
Comparing just tax rates, as is commonly done, ignores important
differences in tax bases that affect the total taxes paid.
This report uses effective tax rates to adjust for differences in bases.
Several methods that are used to calculate effective tax rates are
reviewed: hypothetical firm analysis (Tables 1, 2 and 3), business taxes
as a percentage of private gross state product (Graph 1), taxes per capita
and taxes per $1000 of personal income (Table 4).
This paper compares Missouri and its neighbors. On the measures of
effective tax rates reviewed, Missouri ranks as a middle or low tax state
in comparison with its neighbors (Table 5).
Taxes are but one of many factors, such as labor and other input costs,
that enter into a firm’s decision making. In addition, the use of tax
revenues to fund infrastructure, public safety and education are
examples of expenditures that firms rely on to lower their costs.
Dr. Judith Stallmann is a
Professor of Agricultural
and Applied Economics,
Rural Sociology and Public
Affairs Community
Development Extension
Specialist at the University
of Missouri
Andrew Wesemann is a
Doctoral Candidate,
Truman School of Public
Affairs, University of
Missouri
Dr. David Valentine is a
Senior Research Fellow in
the Institute of Public
Policy, Truman School of
Public Affairs, University
of Missouri

Comparing Taxes in Missouri and Surrounding States Report 07-2013
2
programs is unclear, Kansas’ action has triggered a discussion about taxes and economic
development in Missouri and other states bordering Kansas.
This brief summarizes studies of several measures of taxation in Missouri and the eight
surrounding states under the assumption that multiple measures will provide more reliable
indicators of a state’s overall tax policy. However, numerous other factors influence a state’s
economic growth and therefore studies that rely solely on taxes provide an incomplete portrayal
of state conditions.
A Word on Methodology
This report summarizes existing analyses and data sources that use a variety of measures to
present cross-state comparisons. Those involved in economic development policy typically use
just one measure, the one that is the most advantageous to their position, to demonstrate the
value of, or detrimental effects of proposed economic development strategies. There is
significant variability in the measures used and any single measure in isolation can produce
misleading conclusions about a state’s taxes. To compensate for this problem, we rank the states
using multiple measures. We can gain confidence in the results when these measures are
reasonably consistent for states used in the comparison.
Before proceeding, however, it is important to note that cross-state comparisons of taxes are
fraught with difficulty. For example, discussions of taxes often begin with a discussion of tax
rates but taxes paid are a combination of the tax rates and the tax base. The tax base defines
what is taxed and the tax rate defines by how much the base is taxed. Often there are exemptions
from a base and those exemptions, which vary by state, affect the size of the base and the actual
taxes paid. Given these issues, one common alternative is to calculate an effective tax rate. This
begins by taking the broadest definition of the base that is used and comparing all other bases to
it. For example, a corporation without any tax incentives has a broader base than a firm with
incentives. Though each may pay the same official tax rate the first firm has a higher effective
rate than the latter because it has a larger base.
We review several recent studies which use the most common methods of estimating effective
tax rates. We first examine effective tax rates drawing on hypothetical firm analyses, a tool used
by economists to simplify and standardize cross-state comparisons. These comparisons enable
us to estimate the level of taxation on businesses, including mature and new firms, and rank each
of the nine states on each measure. We also examine business taxes as a percentage of private
gross state product. Finally, we examine per capita taxes and taxes per $1,000 of personal
income as measures of tax policy in the states. We use these measures to rank the nine states
considered in this analysis. We recognize that taxes are only a part of the economic development
picture. We return to this point in the conclusion.
Assessing Effective Tax Rates Using a Hypothetical Firm Analysis
One method to compare effective tax rates across states is to construct a hypothetical or
representative firm and apply the existing tax laws of each state to the firm and compare the
calculated tax rate or the after-tax rate of return. As the term “hypothetical” indicates, the firm is
simplified to its most important aspects, rather than using all of its details. In addition, state tax
systems are simplified, usually by focusing on the major taxes paid by the majority of firms.

Comparing Taxes in Missouri and Surrounding States Report 07-2013
3
Two recent national studies use this approach, describing representative firms in several sectors
and then applying the tax laws of the state. The first was conducted by Ernst & Young (2011)
and the second was produced by the Tax Foundation (2012). Each study has its own focus and
its own set of assumptions (see Appendix A for a comparison of the assumptions). It should be
pointed out that these studies are representative only of the types of firms included and not
business taxes for the entire state.
Ernst & Young (2011) focuses on investment by new firms and calculates the 30-year average
effective tax rate for that firm beginning with tax year 2009. Five types of firms were selected
specifically because of their mobility—headquarters, research and development, office and
career center, and both durable and non-durable manufacturing. The financial characteristics of
each type of firm were held constant across states to isolate the effect of taxes. The taxes
included were corporate income, franchise and gross receipts taxes; sales and use taxes on
business purchases; and property taxes (see Appendix A for more detail). The Ernst & Young
effective tax rates for Missouri and the surrounding states are presented in Table 1. Using the
Ernst & Young measure, Illinois, Iowa and Kentucky have the lowest effective tax rates,
Nebraska, Tennessee and Kansas have the highest, and Missouri falls in the middle third.
TABLE 1: ERNST AND YOUNG OVERALL EFFECTIVE TAX RATES FOR A
30-YEAR INVESTMENT BEGINNING IN 2009 FOR HYPOTHETICAL FIRMS
1
*
(Weighted by capital investment)
State
Effective Tax Tate
State Rank
Arkansas
8.9%
6
Illinois
4.6%
1
Iowa
6.4%
2
Kansas
11.2%
9
Kentucky
6.5%
3
Missouri
7.1%
4
Nebraska
9.4%
7
Oklahoma
8.8%
5
Tennessee
10.3%
8
*1 is the lowest rank and indicates the lowest tax level.
Source: Ernst & Young (2011), Table 2, p. 9.
Based on tax law as of April, 2011, the Tax Foundation (2012) conducted a hypothetical firm
analysis for seven types of mobile firms—corporate headquarters, research and development
center, capital-intensive manufacturing, labor-intensive manufacturing, call center, distribution
center, and retail store. The firms were divided into categories based on the likelihood that they
would locate in a large city (corporate headquarters, call center and retail store) or mid-sized city
(the other types of firms), because these factors affect their local taxes. For Missouri the major
city is St. Louis and the mid-sized city is Joplin. As with the Ernst & Young (2011) study, all
firms are corporations, that is, they are taxpaying rather than tax pass-through entities.
1
Data on Kansas taxes presented throughout this report do not reflect the 2012 tax changes.

Comparing Taxes in Missouri and Surrounding States Report 07-2013
4
The effective tax rate is based on corporate income, capital stock, unemployment, sales,
property, gross receipts and inventory taxes. Effective rates are calculated for mature firms (10
years or older) and new firms (3 years or less) since new firms may be able to take advantage of
tax incentives—new job credits and new hire withholding rebates, investment tax credits, R&D
credits, property tax abatements, exemptions for sales taxes on equipment, depreciation of
buildings and personal property (Tax Foundation, 2012). The national average tax is given a
score of 100 and the score for each state is their percentage relative to the national average.
TABLE 2: TAX FOUNDATION STATE TAX INDEX FOR 2011: OVERALL EFFECTIVE
TAX RATE AS A PERCENTAGE OF THE NATIONAL AVERAGE TAX RATE*
State
Mature
Firm Index
Mature
Firm Rank
New Firm
Index
New Firm
Rank
Arkansas
102.8
5
69.6
4
Illinois
126.4
8
94.2
5
Iowa
116.5
7
126.8
8
Kansas
133.5
9
141.6
9
Kentucky
88.4
3
69.4
3
Missouri
108.8
6
97.0
6
Nebraska
82.5
1
31.7
1
Oklahoma
87.1
2
65.3
2
Tennessee
101.3
4
108.7
7
*Lowest rank indicates lowest tax index score; 1=lowest taxes.
Source: Tax Foundation (2012), Table 7, p. 14.
Table 2 indicates how each of the nine states’ effective tax rates affect mature and new
hypothetical firms and compares those rates to the national average. Only Nebraska, Oklahoma
and Kentucky have overall tax rates that are lower than the national average for mature firms
while six of the nine states, including Missouri, tax mature firms at a higher rate than the national
average. Alternatively, six of the states have tax rates for new firms that are lower than the
national average. Iowa, Kansas and Tennessee have tax rates for new firms higher than the
national average. The mature and new firm rankings for seven of the nine states, including
Missouri, are similar across both measures.

Comparing Taxes in Missouri and Surrounding States Report 07-2013
5
TABLE 3: RANKINGS FROM THE HYPOTHETICAL FIRM ANALYSES*
State
Ernst & Young
Rank
Tax Foundation
Mature Firm Rank
Tax Foundation
New Firm Rank
Arkansas
6
5
4
Illinois
1
8
5
Iowa
2
7
8
Kansas
9
9
9
Kentucky
3
3
3
Missouri
4
6
6
Nebraska
7
1
1
Oklahoma
5
2
2
Tennessee
8
4
7
*1 is the lowest rank and indicates the lowest effective tax rate (Ernst & Young) and the lowest tax
index score (Tax Foundation).
Source: Ernst & Young (2011), Table 2, p. 9; Tax Foundation (2012), Table 7, p. 14.
Table 3 presents the state rankings from the two hypothetical firm studies to demonstrate the
range of results for each of the nine states. Some states have relatively little variation across the
three measures, including Arkansas, Kansas, Kentucky, and Missouri. Most of these states,
including Missouri, have fairly consistent “middling” rankings. Only Kentucky and Kansas have
the same rank on all three measures. Kentucky ranks third lowest and Kansas ranks highest.
Now consider the states where the variation is wider, such as Illinois, Iowa and Nebraska. Here,
the conclusions that one might draw depend upon which study is examined. Put differently,
states may appear more or less attractive to firms in terms of effective tax rates that are produced
by the hypothetical firm calculations. Consequently, it is important to proceed with caution
when making conclusions regarding state effective tax rates because each study makes different
assumptions about the firm and the state (see Appendix A). In these hypothetical firm studies, as
in all economic development studies, the assumptions can critically influence the findings. For
example, effective tax rates are likely higher in the Tax Foundation study because it includes
sales taxes charged to consumers. It should also be noted that the analysis applies only to the
types of firms studied and, in the case of Tax Foundation study, to the particular cities chosen
within each state.
Business Taxes as a Percentage of Private Gross State Product
An alternative to calculating effective tax rates through hypothetical firm analyses is to use
business taxes as a percentage of value added by firms in the state, the private gross state
product. Ernst & Young (2012) use this approach to calculate an average tax rate per dollar of
value added in each state. The taxes include “business property taxes, sales and excise taxes paid
by businesses on their input purchases, gross receipts taxes, corporate income and franchise
taxes, business and corporate license taxes, unemployment insurance taxes, individual income
taxes paid by owners of non-corporate (pass-through) businesses, and other state and local taxes
that are the statutory liability of business taxpayers (Ernst & Young, 2012, p.1).” This is a
broader range of taxes than what is included in the hypothetical firm studies above. The Ernst &
Young study does not take tax shifting to another state into account; however, except for the case
Comparing Taxes in Missouri and Surrounding States Report 07-2013
6
of severance taxes and tourism taxes, there is no reason to think that firms in one state can shift
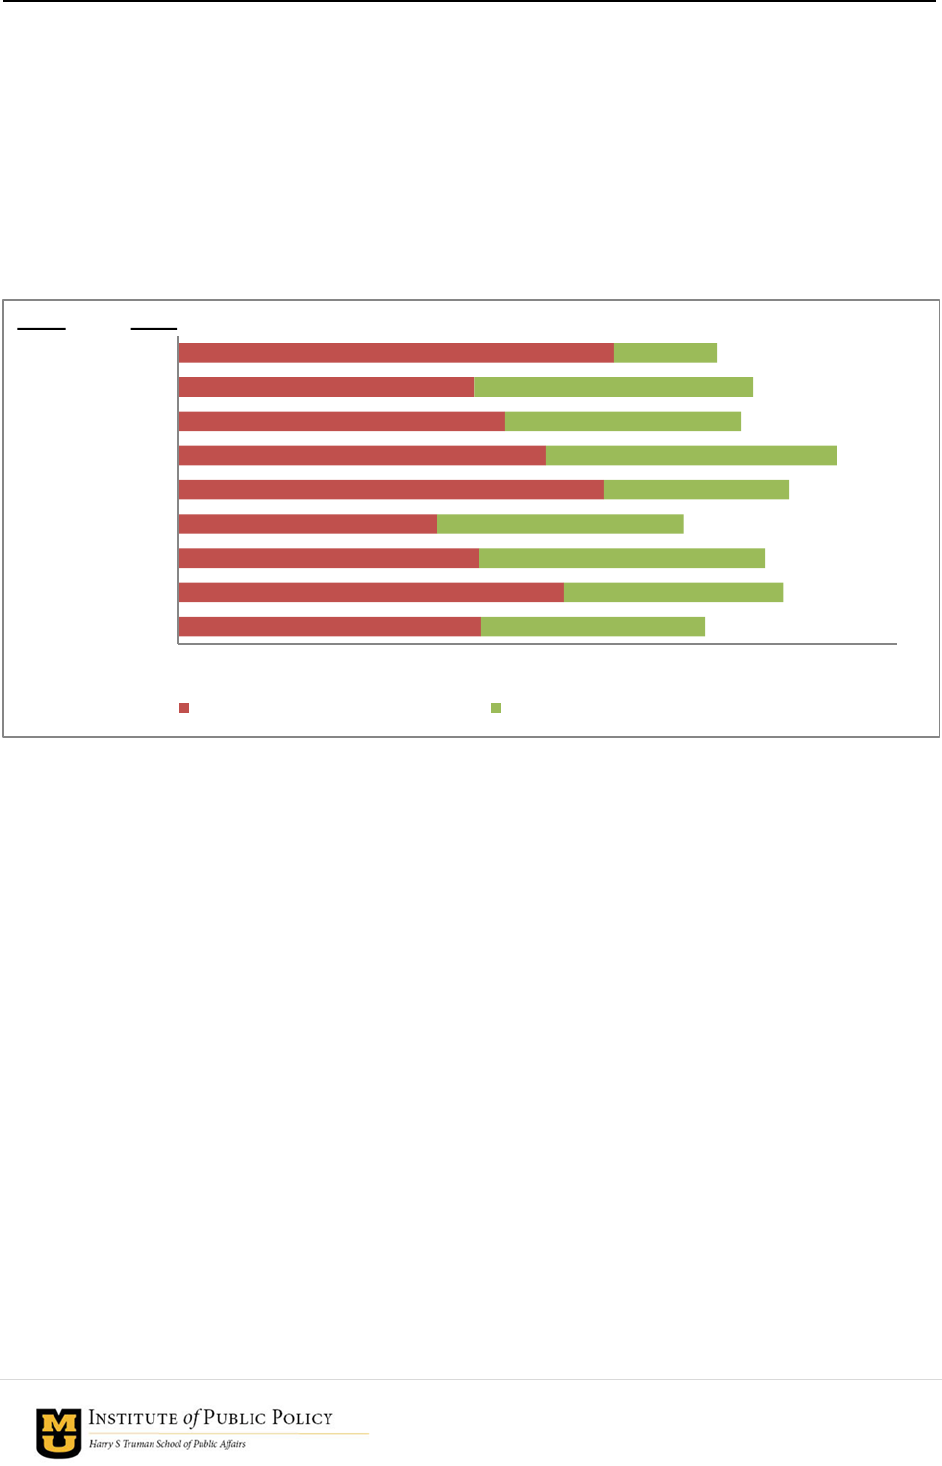
taxes more than firms in another state. State and local taxes as a percentage of private gross state
product are presented in Graph 1. For all of the states, local taxes are a lower percentage than
state taxes. For Missouri, the state with the lowest taxes as a percentage of private gross state
product, the two taxes are nearly the same percentage.
GRAPH 1: STATE AND LOCAL BUSINESS TAXES AS A PERCENTAGE OF PRIVATE
GROSS STATE PRODUCT, 2011*
*Private gross state product is the total value of annual production of goods and services within the state by the
private sector (i.e. nongovernmental, business entities) (Ernst & Young, 2012, p. 10).
Source: Ernst & Young 2012, Table 4, p.11.
Taxes Per Capita and Per $1,000 of Personal Income
Researchers have also looked for easier ways to calculate tax comparisons, such as taxes per
capita, and taxes per $1,000 of personal income (or as a percentage of personal income). These
calculations include all taxes in the state, not just business taxes. These are used for several
reasons: 1) data on tax revenues, population and personal income are readily available by state;
2) all taxes at some point are paid by individuals (even the corporate income tax is passed to
individuals in the form of lower dividends and/or higher prices because taxes are a cost to the
firm); and 3) because all taxes are included, no assumptions are required to allocate how much of
a tax (such as the property tax) is paid by businesses versus individuals. While the effective tax
rate will differ from the previous calculations there is no a-priori reason to think that rankings
will be affected in one direction or another.
2.5%
3.2%
2.5%
2.2%
3.6%
3.1%
2.7%
2.5%
3.6%
1.9%
1.8%
2.4%
2.1%
1.5%
2.4%
2.0%
2.3%
0.9%
0.0% 1.0% 2.0% 3.0% 4.0% 5.0% 6.0%
Tennessee 2
Oklahoma 8
Nebraska 6
Missouri 1
Kentucky 8
Kansas 9
Iowa 4
Illinois 5
Arkansas 3
State Total as % of private GSP Local Total as % of private GSP
State Rank

Comparing Taxes in Missouri and Surrounding States Report 07-2013
7
TABLE 4: STATE AND LOCAL TAX REVENUE PER CAPITA AND AS A
PERCENTAGE OF PERSONAL INCOME*
State
Per Capita State & Local
Tax Revenue, 2009
State
Rank
State & Local Tax Revenue as a
Percentage of Personal Income,
2009
State
Rank
Arkansas
$3,262
4
10.2%
5
Illinois
$4,397
9
10.8%
9
Iowa
$3,717
6
10.6%
8
Kansas
$4,070
7
10.6%
8
Kentucky
$3,213
3
10.0%
4
Missouri
$3,210
2
8.9%
2
Nebraska
$4,092
8
10.5%
6
Oklahoma
$3,319
5
9.7%
3
Tennessee
$2,841
1
8.4%
1
*1 is the lowest rank and indicates the lowest tax level.
Source: O’Leary Morgan and Morgan (2012), p. 301 & 303.
Missouri has the 2
nd
lowest taxes on these two measures, with only Tennessee lower. As shown
in Graph 1 Missouri had the lowest taxes as a percentage of private state gross product. The data
presented in Graph 1 and Table 4 are consistent across most states; Kansas is among those in the
highest third of states on the measures in Graph 1 and Table 4. The ranking of Illinois, however,
ranges from highest in Table 4 to fifth in Graph 1.
Discussion and Conclusion
Table 5 presents a summary of state rankings from the analysis above to demonstrate both the
variability and consistency of state tax data across these very different measures.

Comparing Taxes in Missouri and Surrounding States Report 07-2013
8
TABLE 5: SUMMARY OF STATE TAX RANKINGS ON HYPOTHETICAL FIRM
ANALYSES, PERCENTAGE OF PRIVATE GSP, REVENUE PER CAPITA AND AS
A PERCENTAGE OF PERSONAL INCOME *
State
Ernst &
Young
Hypothetical
Firm Rank
Tax
Foundation
Hypothetical
Mature Firm
Rank
Tax
Foundation
Hypothetical
New Firm
Rank
Ernst & Young
Business Taxes as
a Percentage of
Private GSP,
2011 Rank
State &
Local Tax
Revenue
Per Capita,
2009 Rank
State & Local
Tax Revenues as
a Percentage of
Personal Income,
2009 Rank
Arkansas
6
5
4
3
4
5
Illinois
1
8
5
5
9
9
Iowa
2
7
8
4
6
8
Kansas
9
9
9
9
7
8
Kentucky
3
3
3
8
3
4
Missouri
4
6
6
1
2
2
Nebraska
7
1
1
6
8
6
Oklahoma
5
2
2
8
5
3
Tennessee
8
4
7
2
1
1
*1 is the lowest rank and indicates the lowest tax level.
Source: Ernst & Young (2011) Table 2, p. 9; Tax Foundation (2012) Table 1, p. ix; O’Leary Morgan and Morgan
(2012), p. 301 & 303.
We find some consistency in the rankings across the states. In particular, Arkansas, Kentucky,
Missouri, and Tennessee typically are the states with lowest taxes. Conversely, Illinois, Iowa,
Kansas, and Nebraska generally are among the states with higher taxes. Oklahoma, however,
generally ranks close to the middle on most measures. Part of the variability is because each
measure makes different assumptions and these assumptions affect the results. A state’s tax
system can be portrayed in either a positive or negative light, depending upon which metric one
chooses to utilize. Thus, it is crucial to consider multiple methods for examining state tax
systems.
Note that in all measures, except those from the Tax Foundation study, Missouri ranks lower
than fifth (that is, among those with lowest taxes) while Kansas ranks ninth on four of the six
measures (and ranks seventh and eighth on the remaining two). These findings have important
implications given the recent tax cuts enacted in Kansas in hopes of spurring economic
development and the push by its neighbors, including Missouri, to follow suit. If low taxes lead
to economic development, then Missouri and several of its neighbors, with consistently low to
mid-range taxes should be experiencing substantially higher levels of economic development
than others in this comparison.
Proposals for tax cuts in Missouri must take into account the provisions of the Hancock
Amendment. This Amendment limits annual legislatively approved tax increases to $84 M in
FY 2013, without voter approval, making it quite difficult to increase taxes once they are cut. If
Missouri adopts significant tax cuts, it will have substantial difficulty raising taxes if the need
arises. In contrast, the same policy obstacles do not exist for Kansas, as it is not limited by
legislation like the Hancock Amendment.

Comparing Taxes in Missouri and Surrounding States Report 07-2013
9
But a wide range of costs factor into firms’ decisions, not just tax rates and taxes paid. In fact,
Ernst & Young (2012) suggest that non-tax cost differentials, such as labor, utility, and
transportation costs are generally “the most significant variable business costs” which
substantially influence firms’ investment location decisions. There is also evidence that firms
consider factors not directly related to either taxes or incentives when evaluating locations,
including infrastructure, availability of a quality work force, and quality of life issues (Karakaya
& Canel, 1998; Love & Crompton, 1999; Gabe & Bell, 2004).
Taxes are only one of the policy levers that states have at their disposal. The other side of the tax
coin is state expenditures, which influence firms’ costs, such as transportation, public safety and
education. In a review of the literature, Fisher (1997) finds that in general, public services,
government spending, and public capital—specifically transportation, public safety, and
education—have both a positive and statistically significant impact on economic development.
In addition several reviews of the literature that focus on both taxes and expenditures find that
any positive impact of a tax cut is less than the negative impact of the corresponding cut in
public spending (Bartik 1992 and 1994, Lynch 2004). Lynch (2004, p. 12) argues that
“businesses need to know that they can rely on high-quality, well-administered public services to
facilitate the conduct of their enterprises.”
In sum, this analysis demonstrates that no single metric or study can provide a comprehensive
understanding of a state’s tax system, given the substantial variability that can exist. However,
when multiple analyses reveal consistent results, it is possible to make preliminary conclusions.
As underscored above, Missouri consistently ranked among the lower half of its neighbor states
on a majority of the six measures of effective tax rates used in this analysis. In addition, there
are numerous other factors not directly related to taxes that can impact states attractiveness and
competiveness including expenditures for public services on which businesses rely (e.g.
transportation, public safety, and education).
References
Bartik, T. (1992). The Effects of State and Local Taxes on Economic Development: A Review of Recent
Research. Economic Development Quarterly, 102-110.
Bartik, T. (1994). Jobs, Productivity, and Local Economic Development: What Eceonomic Implications
does Economic Research Have for the Role of Government? National Tax Journal, 847-861.
Ernst & Young. (2011). Competitiveness of State and Local Business Taxes on New Investment: Ranking
States by Tax Burden on New Investment. Washington D.C.: Ernst & Young. Retrived from
http://www.cost.org/Page.aspx?id=69994
Ernst & Young. (2012). Total State and Local Business Taxes: State-by-State Estimates for Fiscal Year
2011. Washington DC: Ernst & Yong. Retrived from http://www.cost.org/Page.aspx?id=69654
Fisher, R. C. (1997). The Effects of State and Local Public Services on Economic Development. New
Engalnd Economic Review, 54-82.
Gabe, T. M., & Bell, K. P. (2004). Tradeoffs between Local Taxes and Government Spending as
Determinants of Business Location. Journal of Regonal Science, 21-41.

Comparing Taxes in Missouri and Surrounding States Report 07-2013
10
Karakaya, F., & Canel, C. (1998). Underlying Dimensions of Business Location Decisions. Industrial
Management and Data Systems, 321-329.
Love, L. L., & Crompton, J. L. (1999). The Role of Quality of Life in Business (Re)Location Decisions.
Journal of Business Research, 211–222.
Lynch, R. G. (2004). Rethinking Growth Strategies: How State and Local Taxes and Services Affect
Economic Development . Washington DC: Economic Policy Institute. Retrived from
http://www.epi.org/publication/books_rethinking_growth/
O'Leary Morgan, K., & Morgan, S. (2012). State Rankings 2012: A Statistical View of America. CQ Press
and SAGE Publications.
Peters, Mark. “Kansas Governor Signs Tax-Cut Bill: Drop in Income-Tax Rates, Backed by Tea Party
as Economic Stimulus, Drew Flak From Some in GOP.” The Wall Street Journal, US Edition.
May 22, 2012, 9:12 p.m. ET.
http://online.wsj.com/article/SB10001424052702304791704577418641784902500.html
Tax Foundation . (2012). Location Matters: A Comparative Analysis of State Tax Costs on Business.
Washington DC: Tax Foudation. Retrived from
http://taxfoundation.org/sites/taxfoundation.org/files/docs/location%2520matters.pdf

Comparing Taxes in Missouri and Surrounding States Report 07-2013
11
APPENDIX A: HYPOTHETICAL FIRM ANALYSIS ASSUMPTIONS
Ernst & Young
Tax Foundation
The analysis is for C corporations, not pass
through entities.
The analysis is for C corporations, not pass
through entities.
For a 30-year investment beginning in 2009.
For a single year—2011.
Focused on mobile firms: headquarters, research
and development, office and career center, and
both durable and non-durable manufacturing.
Focused on mobile firms: corporate
headquarters, research and development center,
capital-intensive manufacturing, labor-intensive
manufacturing, call center, distribution center,
and retail store.
Taxes included: corporate income, franchise and
gross receipts taxes; sales and use taxes on
business purchases; and property taxes.
Taxes included: property taxes, corporate
income taxes, sales taxes, unemployment
insurance taxes, capital stock taxes, inventory
taxes, and gross receipt taxes.
Included sales taxes only on business purchases;
did not include retail sales taxes charged to
consumers.
Included sales taxes on business purchases and
retail sales taxes charged to consumers.
The property tax rate of the largest city in the
state is used. For Missouri it is St. Louis.
Uses two sizes of cities and each type of firm is
located only in the larger or smaller city. For
Missouri these are St. Louis and Joplin.
The local sales tax rate is the weighted average
by sales of local sales taxes.
The local sales tax rate is based on the location
of the hypothetical firm. For Missouri this is St.
Louis or Joplin.
Does not include the unemployment insurance
tax because the tax is firm specific.
Includes the unemployment insurance tax.
Calculated the effective tax rate over a 30-year
investment beginning in 2009 and phased in
changes that are written into current tax law
through 2014.
Calculated effective tax rates for a single year,
2011. Effective tax rates are converted to an
index—the percentage above or below the
national average tax rate for that type of firm.
The national average is set at 100.
Included tax credits available to most firms, but
did not include discretionary incentives. Taxes
specific to a particular industry—severance tax,
utility tax, etc. are not included as these types of
firms were not included as hypothetical firms.
Mature firms are not eligible for incentives.
Included discretionary incentives for new
firms—new job credits and new hire withholding
rebates, investment tax credits, R&D credits,
property tax abatements, exemptions for sales
taxes on equipment, depreciation of buildings
and personal property.
The analysis does not estimate tax shifting by the
firm to other business entities or consumers
except for the retail sales tax, which it assumes
consumers pay.
The analysis does not estimate tax shifting by the
firm to other business entities or consumers. It
assumes that firms do not shift the retail sales tax
to consumers.
Calculated a weighted overall tax rate for all
firms using the percentage of new investment in
each type of firm as the weight.
Calculated the overall tax rate for all firms by
using a simple average of the types of
hypothetical firms.
Source: Ernst & Young (2011); Tax Foundation (2012).

Comparing Taxes in Missouri and Surrounding States Report 07-2013
12
APPENDIX B: EFFECTIVE TAX RATE NATIONAL RANKINGS OF MISSOURI
AND NEIGHBORING STATES *
State
Ernst &
Young
National
Rank
Tax
Foundation
Mature Firm
National
Rank
Tax
Foundation
New Firm
National
Rank
State & Local
Tax Revenue
Per Capita,
2009 National
Rank
State & Local
Taxes as a
Percentage of
Personal Income,
2009 National
Rank
Ernst & Young
Business Taxes as a
Percentage of Private
GSP, 2011* National
Rank
Arkansas
36
30
8
13
23
16.5
Illinois
5
45
24
37
35
23.5
Iowa
14
40
41
28
31.5
21.5
Kansas
48
47
48
32
31.5
35.5
Kentucky
15
18
7
11
20
30.5
Missouri
22
36
26
10
5
9.0
Nebraska
41
9
1
33
28
26.0
Oklahoma
35
16
5
14
15
30.5
Tennessee
45
29
29
2
2
13.5
*1 is the lowest rank and indicates the lowest tax level.
Source: Ernst & Young (2011) Table 2, p. 9; Tax Foundation (2012) Table 1, p. ix; O’Leary Morgan and Morgan
(2012), p. 301 & 303; Ernst & Young (2012) Table 4, p.11 .
